
User:2002crash1/sandbox

144,079,661 gen election

Out of 82709753
| |||||||||||||||||||||||||||||||||||||
538 members of the Electoral College 270 electoral votes needed to win | |||||||||||||||||||||||||||||||||||||
|---|---|---|---|---|---|---|---|---|---|---|---|---|---|---|---|---|---|---|---|---|---|---|---|---|---|---|---|---|---|---|---|---|---|---|---|---|---|
| Turnout | 54.2%[1] | ||||||||||||||||||||||||||||||||||||
| |||||||||||||||||||||||||||||||||||||
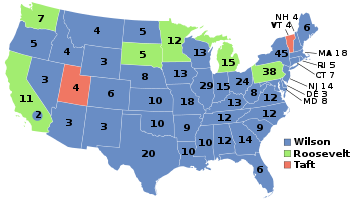
 Presidential election results map. Blue denotes states won by Brown/Lucey and red denotes those won by Wallace/Mondale. Numbers indicate electoral votes cast by each state. | |||||||||||||||||||||||||||||||||||||
| |||||||||||||||||||||||||||||||||||||

_(3x4).jpg)
.png)
| ||||||||||||||||||||||||||||||||||||||||||||||||||||||
4,750 delegate votes to the Democratic National Convention 2,376 delegates votes needed to win | ||||||||||||||||||||||||||||||||||||||||||||||||||||||
|---|---|---|---|---|---|---|---|---|---|---|---|---|---|---|---|---|---|---|---|---|---|---|---|---|---|---|---|---|---|---|---|---|---|---|---|---|---|---|---|---|---|---|---|---|---|---|---|---|---|---|---|---|---|---|
| Opinion polls | ||||||||||||||||||||||||||||||||||||||||||||||||||||||
| ||||||||||||||||||||||||||||||||||||||||||||||||||||||
| ||||||||||||||||||||||||||||||||||||||||||||||||||||||
| ||||||||||||||||||||||||||||||||||||||||||||||||||||||

.jpg)

.jpg)
.jpg)
2020 U.S. presidential election | |
|---|---|
| Attempts to overturn | |
| Democratic Party | |
| Republican Party | |
| Third parties | |
| Related races | |
| |
| |||||||||||||||||||||||||||||
538 members of the Electoral College 270 electoral votes needed to win | |||||||||||||||||||||||||||||
|---|---|---|---|---|---|---|---|---|---|---|---|---|---|---|---|---|---|---|---|---|---|---|---|---|---|---|---|---|---|
| Opinion polls | |||||||||||||||||||||||||||||
| Turnout | 66.6% | ||||||||||||||||||||||||||||
| |||||||||||||||||||||||||||||
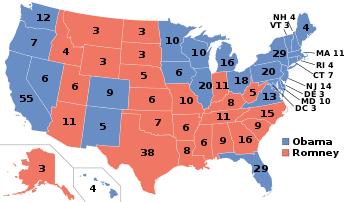
 Presidential election results map. Blue denotes states won by Haley/Harris, and red denotes those won by Harris/Sinema. Numbers indicate electoral votes cast by each state and the District of Columbia. | |||||||||||||||||||||||||||||
| |||||||||||||||||||||||||||||
.jpg)
.jpg)
2020 U.S. presidential election | |
|---|---|
| Attempts to overturn | |
| Democratic Party | |
| Republican Party | |
| Third parties | |
| Related races | |
| |
Hello 1[edit]
| |||||||||||||||||||||||||||||||||||||
538 members of the Electoral College 270 electoral votes needed to win | |||||||||||||||||||||||||||||||||||||
|---|---|---|---|---|---|---|---|---|---|---|---|---|---|---|---|---|---|---|---|---|---|---|---|---|---|---|---|---|---|---|---|---|---|---|---|---|---|
| Opinion polls | |||||||||||||||||||||||||||||||||||||
| Turnout | 58.1%[9] | ||||||||||||||||||||||||||||||||||||
| |||||||||||||||||||||||||||||||||||||
 Presidential election results map. Blue denotes states won by Clinton/Gore and red denotes those won by Bush/Quayle. Numbers indicate electoral votes cast by each state and the District of Columbia. | |||||||||||||||||||||||||||||||||||||
| |||||||||||||||||||||||||||||||||||||

.jpg)
.jpg)
== Hello 2 ==
| |||||||||||||||||||||||||||||||||||||
538 members of the Electoral College 270 electoral votes needed to win | |||||||||||||||||||||||||||||||||||||
|---|---|---|---|---|---|---|---|---|---|---|---|---|---|---|---|---|---|---|---|---|---|---|---|---|---|---|---|---|---|---|---|---|---|---|---|---|---|
| Opinion polls | |||||||||||||||||||||||||||||||||||||
| Turnout | 58.1%[10] | ||||||||||||||||||||||||||||||||||||
| |||||||||||||||||||||||||||||||||||||
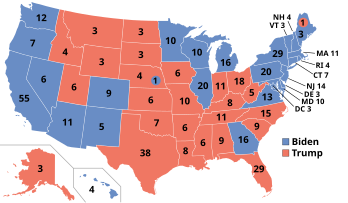
Presidential election results map. Blue denotes states won by Edwards/Richardson and red denotes those won by Trump/Pence. Numbers indicate electoral votes cast by each state and the District of Columbia. | |||||||||||||||||||||||||||||||||||||
| |||||||||||||||||||||||||||||||||||||
.jpg)

This template's initial visibility currently defaults to autocollapse, meaning that if there is another collapsible item on the page (a navbox, sidebar, or table with the collapsible attribute), it is hidden apart from its title bar; if not, it is fully visible.
To change this template's initial visibility, the |state= parameter may be used:
{{2002crash1|state=collapsed}}will show the template collapsed, i.e. hidden apart from its title bar.{{2002crash1|state=expanded}}will show the template expanded, i.e. fully visible.
| |||||||||||||||||||||||||||||||||||||||||||||||||||||||||||||
538 members of the Electoral College 270 electoral votes needed to win | |||||||||||||||||||||||||||||||||||||||||||||||||||||||||||||
|---|---|---|---|---|---|---|---|---|---|---|---|---|---|---|---|---|---|---|---|---|---|---|---|---|---|---|---|---|---|---|---|---|---|---|---|---|---|---|---|---|---|---|---|---|---|---|---|---|---|---|---|---|---|---|---|---|---|---|---|---|---|
| Opinion polls | |||||||||||||||||||||||||||||||||||||||||||||||||||||||||||||
| Turnout | 58.5% | ||||||||||||||||||||||||||||||||||||||||||||||||||||||||||||
| |||||||||||||||||||||||||||||||||||||||||||||||||||||||||||||
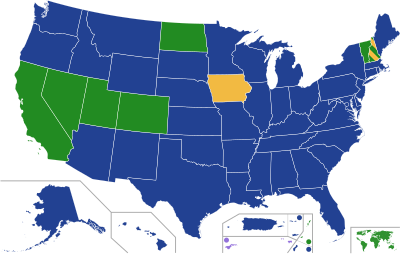
 Presidential election results map. Blue denotes those won by Sanders/Warren, red denotes states won by Weld/Murkowski, dark green denotes those won by Jordan/Palin. Numbers indicate electoral votes cast by each state and the District of Columbia. | |||||||||||||||||||||||||||||||||||||||||||||||||||||||||||||
| |||||||||||||||||||||||||||||||||||||||||||||||||||||||||||||


.jpg)

| |||||||||||||||||||||||||||||||||||||||||||||||||||||||||||||
531 members of the Electoral College 266 electoral votes needed to win | |||||||||||||||||||||||||||||||||||||||||||||||||||||||||||||
|---|---|---|---|---|---|---|---|---|---|---|---|---|---|---|---|---|---|---|---|---|---|---|---|---|---|---|---|---|---|---|---|---|---|---|---|---|---|---|---|---|---|---|---|---|---|---|---|---|---|---|---|---|---|---|---|---|---|---|---|---|---|
| Opinion polls | |||||||||||||||||||||||||||||||||||||||||||||||||||||||||||||
| Turnout | 58.8% | ||||||||||||||||||||||||||||||||||||||||||||||||||||||||||||
| |||||||||||||||||||||||||||||||||||||||||||||||||||||||||||||
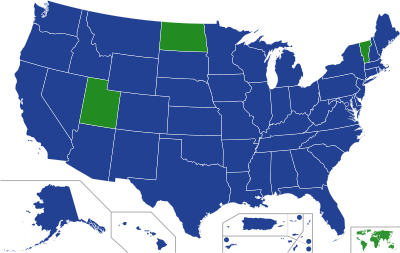
Presidential election results map. Red denotes those won by Pence/Marshall, blue denotes those won by Zuckerberg/Perez, yellow denotes states won by Ventura/Abramson. Numbers indicate the number of electoral votes allotted to each state. | |||||||||||||||||||||||||||||||||||||||||||||||||||||||||||||
| |||||||||||||||||||||||||||||||||||||||||||||||||||||||||||||
.jpg)

.jpg)
| ||||||||||||||||||||||||||||||||||||||||||||||||||||||||||||||||
538 members of the Electoral College 270 electoral votes needed to win | ||||||||||||||||||||||||||||||||||||||||||||||||||||||||||||||||
|---|---|---|---|---|---|---|---|---|---|---|---|---|---|---|---|---|---|---|---|---|---|---|---|---|---|---|---|---|---|---|---|---|---|---|---|---|---|---|---|---|---|---|---|---|---|---|---|---|---|---|---|---|---|---|---|---|---|---|---|---|---|---|---|---|
| Opinion polls | ||||||||||||||||||||||||||||||||||||||||||||||||||||||||||||||||
| Turnout | 69.3% | |||||||||||||||||||||||||||||||||||||||||||||||||||||||||||||||
| ||||||||||||||||||||||||||||||||||||||||||||||||||||||||||||||||
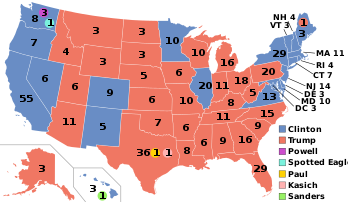
Presidential election results map. Blue denotes those won by Harris/Buttigieg, purple denotes those won by Trump/Kennedy, red denotes states won by Christie/Sasse. Numbers indicate the number of electoral votes allotted to each state. | ||||||||||||||||||||||||||||||||||||||||||||||||||||||||||||||||
| ||||||||||||||||||||||||||||||||||||||||||||||||||||||||||||||||
.jpg)
.jpg)
(crop).jpg)

| |||||||||||||||||||||||||||||||||||||
538 members of the Electoral College 270 electoral votes needed to win | |||||||||||||||||||||||||||||||||||||
|---|---|---|---|---|---|---|---|---|---|---|---|---|---|---|---|---|---|---|---|---|---|---|---|---|---|---|---|---|---|---|---|---|---|---|---|---|---|
| Turnout | 54.2%[15] | ||||||||||||||||||||||||||||||||||||
| |||||||||||||||||||||||||||||||||||||
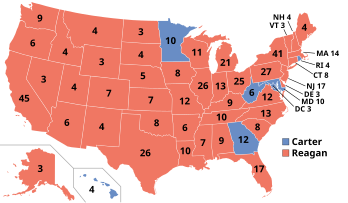
Presidential election results map. Red denotes states won by Reagan/Bush and blue denotes those won by Carter/Mondale. Numbers indicate electoral votes cast by each state. | |||||||||||||||||||||||||||||||||||||
| |||||||||||||||||||||||||||||||||||||


.jpg)
| |||||||||||||||||||||||||||||
538 members of the Electoral College 270 electoral votes needed to win | |||||||||||||||||||||||||||||
|---|---|---|---|---|---|---|---|---|---|---|---|---|---|---|---|---|---|---|---|---|---|---|---|---|---|---|---|---|---|
| Opinion polls | |||||||||||||||||||||||||||||
| Turnout | 58.6%[16] | ||||||||||||||||||||||||||||
| |||||||||||||||||||||||||||||
 Presidential election results map. Red denotes states won by Vail/Lahren and blue denotes those won by Buttigieg/Amo. Numbers indicate electoral votes cast by each state and the District of Columbia. | |||||||||||||||||||||||||||||
| |||||||||||||||||||||||||||||


| |||||||||||||||||||||||||||||||||||||
538 members of the Electoral College 270 electoral votes needed to win | |||||||||||||||||||||||||||||||||||||
|---|---|---|---|---|---|---|---|---|---|---|---|---|---|---|---|---|---|---|---|---|---|---|---|---|---|---|---|---|---|---|---|---|---|---|---|---|---|
| Turnout | 60.1%[18] | ||||||||||||||||||||||||||||||||||||
| |||||||||||||||||||||||||||||||||||||
 Presidential election results map. Red denotes states won by Bush/Cheney and blue denotes those won by Lieberman/Miller. Numbers indicate electoral votes cast by each state and the District of Columbia. On election night, Bush won 306 electors and Lieberman 232. However, because of seven faithless electors (five Democratic and one Republican), Bush received 304 votes and Lieberman 227. | |||||||||||||||||||||||||||||||||||||
| |||||||||||||||||||||||||||||||||||||
.jpeg)
_(cropped).jpg)
- ^ "National General Election VEP Turnout Rates, 1789-Present". United States Election Project. CQ Press.
- ^ a b c d e "Democratic Convention - Nationwide Popular Vote". The Green Papers. Retrieved September 11, 2020.
- ^ a b c d e "Associated Press Election Services - Delegate Tracker". Associated Press. Retrieved April 30, 2020.
- ^ a b c d Cite error: The named reference
FECwas invoked but never defined (see the help page). - ^ "Federal Elections 2016" (PDF). Federal Election Commission. December 2017.
- ^ Table A-1. Reported Voting and Registration by Race, Hispanic Origin, Sex and Age Groups: November 1964 to 2020, U.S. Census Bureau.
- ^ "US Elections Project – 2020g". www.electproject.org. Retrieved November 14, 2022.
- ^ "US Elections Project – 2016g". www.electproject.org. Retrieved November 14, 2022.
- ^ "National General Election VEP Turnout Rates, 1789-Present". United States Election Project. CQ Press.
- ^ "National General Election VEP Turnout Rates, 1789-Present". United States Election Project. CQ Press.
- ^ "Federal Elections 2016" (PDF). Federal Election Commission. December 2017.
- ^ Table A-1. Reported Voting and Registration by Race, Hispanic Origin, Sex and Age Groups: November 1964 to 2020, U.S. Census Bureau.
- ^ "US Elections Project – 2020g". www.electproject.org. Retrieved November 14, 2022.
- ^ "US Elections Project – 2016g". www.electproject.org. Retrieved November 14, 2022.
- ^ "National General Election VEP Turnout Rates, 1789-Present". United States Election Project. CQ Press.
- ^ "National General Election VEP Turnout Rates, 1789-Present". United States Election Project. CQ Press.
- ^ a b Cite error: The named reference
FEC 2013was invoked but never defined (see the help page). - ^ "National General Election VEP Turnout Rates, 1789-Present". United States Election Project. CQ Press.
Cite error: There are <ref group=lower-alpha> tags or {{efn}} templates on this page, but the references will not show without a {{reflist|group=lower-alpha}} template or {{notelist}} template (see the help page).